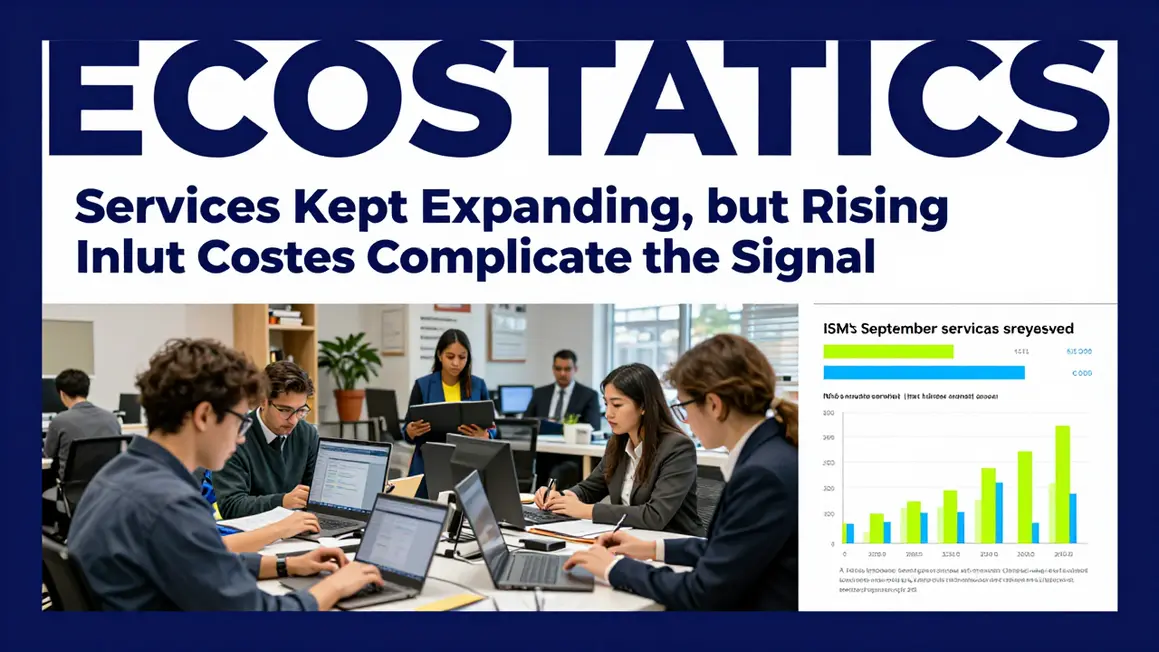
U.S. services activity continued to expand in September, according to the Institute for Supply Management’s monthly survey, but businesses also reported broad input-price pressure. The Services Purchasing Managers’ Index registered 54.9, down from 55.4 in August, while the Prices Index rose to 74.0, its highest reading since July 2022. The contrast is useful: the survey points to ongoing business activity alongside rising costs, not an economy in which demand has stopped or consumer prices have risen by 74%.
The index is a diffusion measure. It summarizes whether respondents generally report improvement or deterioration compared with the prior month. A reading above 50 indicates that the measured activity is expanding or that more respondents report increases than decreases, depending on the component. It does not measure the percentage change in output, prices or employment.
Activity remains above the expansion threshold
The overall Services PMI was 54.9, marking the 27th consecutive month in expansion territory, ISM reported. Within the survey, the Business Activity Index fell to 56.5 from 61.7, and New Orders eased to 59.8 from 60.9. Both remained above 50, indicating that growth reports continued to outnumber contraction reports, even as their readings declined.
The Employment Index moved to 50.1 from 47.8 in August, just above the threshold associated with expansion. That is a survey signal, not a count of jobs or a substitute for the Bureau of Labor Statistics’ payroll data. A reading barely above 50 suggests only a narrow balance of responses favoring expansion. It cannot establish how many people were hired, whether hours increased or what happened to wages.
Supplier deliveries registered 53.2. ISM interprets a value above 50 on this component as slower deliveries, rather than faster ones. Slower delivery reports can accompany strong demand or supply constraints; the reading alone cannot identify which factor is responsible in an individual industry. The survey provides a broad business pulse, not a shipment ledger.
The prices index is about breadth, not magnitude
The Prices Index rose to 74.0 from 72.6. That high reading indicates that price increases were widely reported among surveyed services businesses. It does not mean service prices rose 74%, nor does it reveal the average size of increases. The index is not the Consumer Price Index or the Personal Consumption Expenditures price index, which measure price changes using different data and methods.
The distinction is important for households. A widespread report of higher input costs can be a reason to watch future prices, but it cannot show whether a consumer will pay more for a particular service. Firms may pass costs to customers, absorb them in lower margins, renegotiate supplier arrangements, reduce other expenses or raise prices only when contracts reset. A survey reading by itself cannot distinguish among those choices.
ISM said fuel had been reported as up in price for an eighth consecutive month and that fuel costs were mentioned by respondents more frequently than any other single issue affecting performance. Respondents also cited tariffs and supply constraints. Those comments offer context about what businesses say they are facing, but they are not a representative calculation of the dollar impact across the services economy.
Different businesses face different pressures
The survey covered a mix of industries, with 13 reporting growth and four reporting contraction in September. The experiences reported by a retailer, a bank, a utility or a health-care provider need not be alike. Some businesses buy fuel directly, others rely on transportation suppliers, and others may be more affected by wages, financing or imported materials.
For a small business, rising delivery or supplier costs can create a practical pricing decision: absorb the increase, accept lower margins, change suppliers, or adjust customer prices. The appropriate choice depends on competition, customer sensitivity, contracts and how persistent the cost appears. For a household, this means the survey’s price signal should not be read as an immediate across-the-board increase in service bills.
The survey also reported a 46.9 reading for New Export Orders, down from 56.3 in August. That component fell below 50, even as the overall index remained expansionary. This is one reason not to reduce a varied set of business conditions to a single headline. A growing overall sector can contain weaker components, and month-to-month survey readings can shift.
Use the survey as an early clue
ISM’s survey is valuable because it captures purchasing managers’ reports before many official statistics are available. But it is not a direct measure of the economy’s size, inflation rate or employment level. Its most defensible message is that services activity remained broadly expansionary in September while reports of rising prices were unusually widespread relative to recent years.
Households can treat the release as a reason to follow official inflation measures and the prices they actually pay, rather than as a forecast of a specific bill. Businesses can compare the survey with their own cost data, supplier quotes and contract terms. Policymakers and analysts will look for confirmation in subsequent data on service prices, business activity and labor demand.
The next reports will help show whether the September combination persists or proves temporary. If measured service inflation also strengthens, that would offer stronger evidence that input pressure is passing through. If activity cools or firms absorb costs, the eventual consumer effect may be more limited. For now, the survey shows a sector still growing, with cost pressure that merits attention but does not quantify what consumers will pay.