The 3.1 percent rate is the basket, not every bill
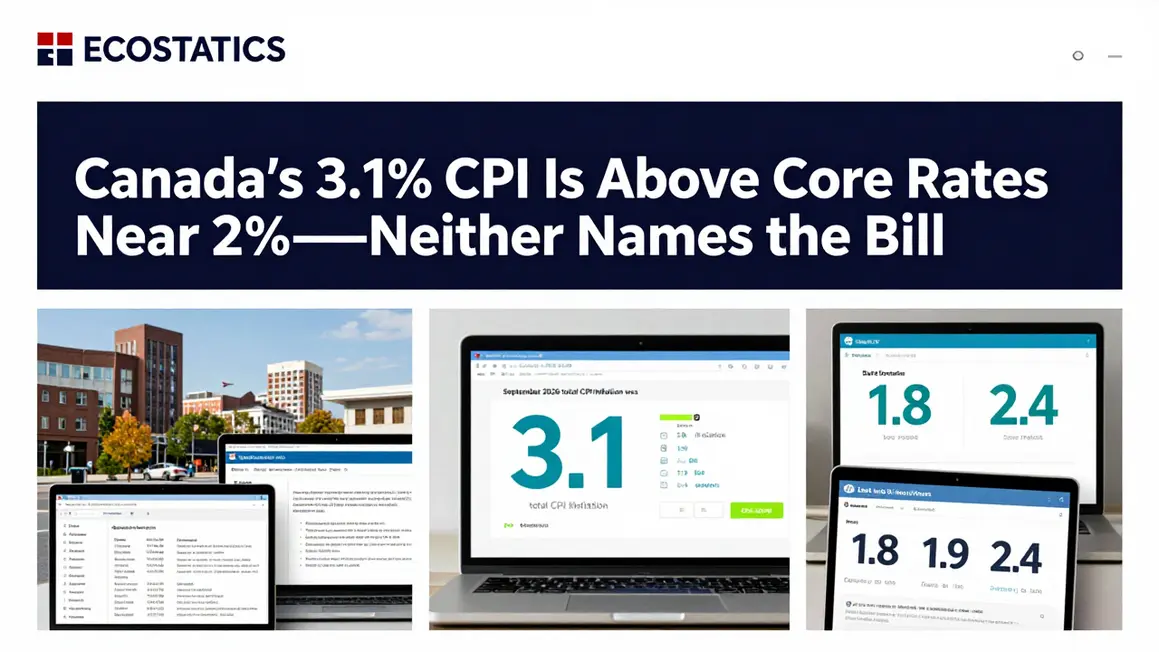
Canada’s total consumer price index rose 3.1 percent in the 12 months to September 2026. On the same Bank of Canada row, CPI-trim was 1.8 percent, CPI-median 1.9 percent, and CPI-common 2.4 percent. That gap is on the Bank’s CPI table, checked October 21, 2026. It does not mean every household bill rose 3.1 percent, and the lower cores are not proof that essentials cooled.
The 3.1 percent figure compares the total index, 170.0 in September 2026, with 164.9 in September 2025. The change (170.0 - 164.9) / 164.9 is about 3.09 percent, reported as 3.1. It is the movement of a national average basket, not a line on a receipt.
A labeled hypothetical applies that ratio to money. Express the September 2025 index as a $1,649 basket. Multiply by 170.0 / 164.9 and the result is $1,700 exactly. The $51 difference is about 3.09 percent of $1,649, the unrounded form of the published rate. The exercise assumes the outlay matches the national basket and nothing else. It is not a real household, and it does not split rent, groceries, or gasoline. This page does not list those bills.
What the September row contains
September’s row shows two total-CPI figures, both 170.0, the 3.1 percent 12-month change, the three preferred cores, and three further series the page labels CPIX, CPI-XFET, and CPIW, at 2.2, 2.1, and 2.5 percent. All six rates sit below the headline. The header marks the preferred core block as seasonally adjusted. It does not define CPI-trim, CPI-median, or CPI-common, and it does not say which prices are excluded.
In August the total index was 169.8 and the 12-month change was 3.0 percent, with preferred cores at 1.9, 2.0, and 2.6 percent. The second total-CPI figure is 169.4 followed by an R. September 2025’s CPI-common rate is 2.8 followed by an R. The fetched page text has no footnote defining R, so the September 2026 headline is not described here as revised or preliminary. The table does not attach either word to it.
The unadjusted index moved from 169.8 in August to 170.0 in September. Directly calculated, that is about 0.12 percent. The table does not publish the one-month rate; the arithmetic only checks the levels. A reader who treats 3.1 percent as the price jump during September is turning a year-over-year comparison into a one-month event.
How the gap opened during 2026
In January 2026 the 12-month total-CPI change was 2.3 percent, while CPI-trim, CPI-median, and CPI-common were 2.4, 2.5, and 2.7 percent. The headline was slightly below each preferred core. By September it was 3.1 percent and those cores were 1.8, 1.9, and 2.4 percent. From January to September the headline was 0.8 percentage point higher, trim and median were each 0.6 point lower, and CPI-common was 0.3 point lower.
Headline minus core in September is 1.3 points for CPI-trim, 1.2 for CPI-median, and 0.7 for CPI-common. In January, trim was 0.1 point above the headline. These are gaps between published rates, not dollars added to a bill.
September 2025 showed the opposite order: a 2.4 percent headline, CPI-trim and CPI-median at 3.1 percent, and CPI-common at the 2.8 reading marked R. Over the next year the headline rose and the preferred cores fell. The table records that reversal and does not give its cause.
Inside 2026 the headline was uneven: 1.8 percent in February, 3.2 percent in May, 3.0 percent in August, and 3.1 percent in September. May is the highest 2026 reading on the fetched table. CPI-trim went from 2.0 percent in April and May to 1.8 percent in September. The latest headline is one-tenth of a point above August, inside the 2.8 to 3.2 percent range printed from April onward.
What a lower core rate cannot say
An average can rise faster than a core reading when the prices that move the average are not the ones that core emphasizes. That is how averages work. It is not evidence that fuel, rent, or food did anything in particular. Those conclusions need component indexes. Calling 1.8 percent proof that essentials cooled, or 3.1 percent proof that every bill rose together, goes beyond the source.
The columns also measure different things. Preferred cores are labeled seasonally adjusted; 3.1 percent is the total CPI’s change over 12 months. One comparison sets recurring seasonal patterns aside. The other compares September 2026 with September 2025. Neither is a household budget or a firm’s costs. A wage gain of 3.1 percent would line up with this basket only if the worker’s purchases resembled it. This table has no wages.
The evidence that would name the bills
A component release would show separate indexes and 12-month rates for shelter, food from stores, gasoline, and other groups, and would need to say whether those figures were preliminary or revised. The Bank table checked on October 21, 2026, is not that release. Until category rates are available, possible effects on a given household or business stay unidentified. The safe reading is narrower: 3.1 percent is the national basket’s annual change, and 1.8, 1.9, and 2.4 percent are September’s preferred core rates.
What this page can show next is whether September 2026 is later revised, whether the headline remains inside the 2.8 to 3.2 percent band in place since April, and whether CPI-trim and CPI-median stay just under 2 percent or close the gap with the headline. None of those results will name a bill. A component table is still the evidence that would connect the gap to rent, groceries, fuel, or another cost.